We narrate our lives in precise prose.
We explain and report and rhyme our lives.
We text and instagram and tweet our lives.
 But what do the layers of our lives look like if we slice them into triangular pieces of pie?
What does our life look like mixed and baked into a pie chart?
How do we chunk our lives into edible bites? How do we show the percentages of living and loving and reading and writing and going and doing?
What does myr pie chart show about my priorities? My preferences? My habits-good and bad?
Exactly how much time do I spend on my iPad playing Jewel Blitz, Pyramid, or Flow? Or reading Flipboard?
What about a pie chart of my feelings? How many days of the week am I happy or frustrated, or sad?
Could I slice my reading into pieces--how much poetry compared to academic reading?
Or my writing-- how much poetry versus other genres?
And if I carefully examine my chart, what is missing? Which piece of pie has been eaten at some earlier time? What piece of pie is not present? Where would it fit? Should it fit?
Bob Kicok explored this idea in his unique poem, From the History of Grade School. (In the book, Words for Empty and Words for Full, this poem includes actual pie charts as part of the poem-- unfortunately, they are not shown on this link.)
The pie chart's the only dessert-related
presentation tooI can think of, there's no eclair graph or Jujubes overhead, which seem strange, even sad, though were I to piechart this sadness versus other sadnesses...

And the pie chart is not the only way we can graphically present, reveal and analyze our lives.
Math, science, architecture and other disciplines, as well as journalism and the media offer a host of configurations in which to picture our lives, to chart our living.
In fact, a quick check in any current news journal will reveal an exponential increase in visual representations to inform and entertain us. We are provoked to deeper thought by images that can sometimes say much more than words alone.
According to Andrew Losowsky in his introduction to Visual Storytelling: Inspiring a New Visual Language:
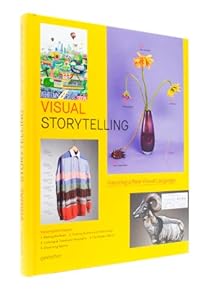
...The colors, typography, style, balance, format of an image will generate that first instinctive smile or frown, attracting or repelling the gaze for reasons we don't fully undesrtand; only if the reader's instincts are sufficiently encouraged to continue focusing on the visual stimuli can the more complex, contextual information come into play. Like the soundtrack in a movie, the visuals create a barely perceptible emotional context to the telling of the main narrative...
One thing is for sure... more than half our brains is dedicated to the processing of visual input, and so pure text and numbers simply cannot convey information in as memorable and digestible a form as that of successful visual-based storytelling.
The images and charts and graphics in this book immediately draw you in. The variety and sometimes surprising content amazes, the creativity and uniqueness of representions impresses, and the volume of information packed into each illustration and image pleasantly overwhelms.
I "read" this book every night for several months when I first got it. I couldn't resist the unusual ways the images forced me to think about information.
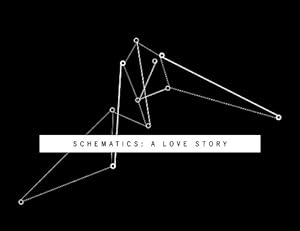 Schematics: A Love Story by Julian Hibbard is a similarly unique and fascinating book in which life is charted and diagramed. This novel, a meditation on love, presented in spare text and actual schematics borrowed from science, math, even science fiction and literature, forces us to reconsider the notion of illustrations and their relationship to text and the telling of a life or story.
Are you now wondering what your ordinary, everyday life would look like in unique visual images?
Are you mentally designing a schematic of your morning or a pie chart of your love life?
Couldn't we all benefit from assembling the sum of our parts in order to better understand the whole?
This is the question asked at the beginning of My Life in Graphs: A Guided Journal: A Personal Compendium of Fill-In Tables, Charts, Diagrams and More.

The introduction to this texts suggests that:
By analyzing our beliefs, habits, quirks, and unhealthy obsessions, we can establish a pattern and maybe even solve the baffling brainteaser of our identity...
This text challenges you to try the variety of diagrams, tables and charts for plotting almost every apsect of your life and personality. As you complete more templates the suggestion is made that you will discover more and more about yourself and the many meanings of your life, your work, your relationships, your accomplishments and more.
This video, Graphs to Explain Your Life, may give you some options to try related to your own life or life in general.
You may also want to plug your data into an online graph generator to create graphs like those in the above video.
This is a sample chart I made using one of the tools, Create a Pie Chart, from the list cited above.

Today's Deeper Writing Possibilities.
Think about your own life or a particular time period, concern, or other specific element of your life.
What graphic or visual image would best represent your life, this concern or element and communicate your thoughts and feelings?
Create a visual representation of your life or part of your life.
You may want to plug your data into an online graph generator to create graphs like those in the above video.
No comments:
Post a Comment